1984 Since Accuracy 100%! US Stock Market Trend Can Predict Presidential Election Results?
Table of Contents
- US Presidential Election Polls
- Stock Market Predicts Election Outcome
- Another Election Prediction Indicator to Watch
US Presidential Election Polls
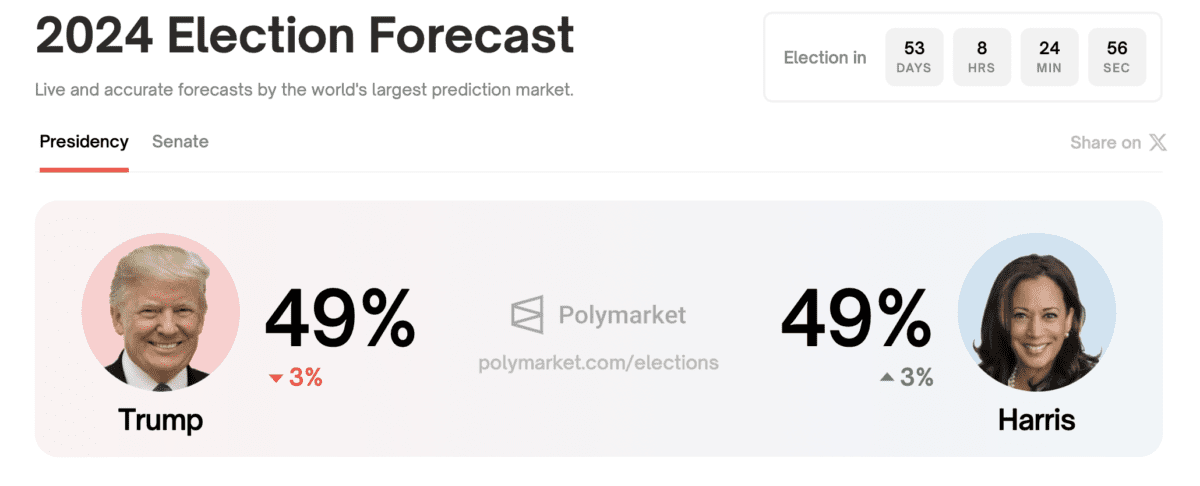
Following the conclusion of the presidential debate between Vice President Kamala Harris and former President Donald Trump, election polls have once again become a hot topic. Harris currently holds a slight edge in multiple polls. The New York Times shows Harris with a 49% win rate versus Trump’s 47%; Project FiveThirtyEight and ABC data show Harris with a 47% win rate compared to Trump’s 44.3%. On Polymarket, the world’s largest prediction market, both Harris and Trump have an equal 49% chance of winning.
While election polls are the main prediction method for elections in most countries, analysts have recently suggested that focusing on stock market fluctuations might be a more accurate predictor of the election outcome in the US.
Stock Market Predicts Election Outcome
According to a report in Fortune magazine, the accuracy of election polls is not consistent. Nathaniel Rakich, senior election analyst at FiveThirtyEight, reviewed hundreds of US election polls since 1998 in 2023 and found that polls had only a 78% accuracy rate, which even dropped to 72% in 2022.
In contrast, the performance of the S&P 500 index from August to October has been a more accurate predictor of the US presidential election results since 1984. Data shows that in the last 10 US presidential elections, the incumbent party always won when the blue-chip index rose during this period (August to October); however, when the S&P 500 fell, it signaled that the opposition party would win.
Data shows that the S&P 500 index has remained slightly up from August to date.
John Lynch, Chief Investment Officer, and Matthew Anderson, Senior Analyst, at Comerica Bank, explained the correlation between the stock market and election results in a client report:
“Stock market performance reflects overall economic sentiment. When voters are satisfied with the direction of the economy, they tend to support the incumbent government. When they are dissatisfied, they are more likely to vote for change."
However, Lynch and Anderson point out that while strong stock market performance in the period leading up to the election is closely related to the incumbent party’s victory, it doesn’t always guarantee victory. For example, in 1976 and 1980, the incumbent party lost the election despite the S&P 500 rising by 14.1% and 13.4% respectively. Both years faced high inflation pressure.
Another Election Prediction Indicator to Watch
John Lynch and Matthew Anderson believe that economic sentiment is one of the main reasons why stock market performance correlates with the election results of the incumbent party. Therefore, there’s another election prediction indicator worth watching: the misery index.
The misery index combines the seasonally adjusted unemployment rate and the annual inflation rate to gauge the economic pressure felt by ordinary Americans. A higher index value means consumers are experiencing more pain from rising prices and job difficulties.
Since 1980, the three-month moving average of the misery index from August to October has accurately predicted the presidential election results. When the index falls, the incumbent party usually wins; when the index rises, it suggests that the incumbent party will lose.
The latest misery index for August is 6.73%, which is lower than the high point of 12.66% reached in July 2022 under the Biden administration but slightly higher than the June figure of 6.57%.
John Lynch and Matthew Anderson say:
“If this rule remains valid in this election, there is still about a 15 basis point adjustment margin for the Democrats. However, the unexpected rise in the unemployment rate in July may pose a potential threat to Vice President Harris’s chances of winning.”